
RBSE Class 12th 2011 Economic & Financial Studies-SS-35-2-2011 Previous Year Papers
Economic & Financial Studies-SS-35-2-2011 from the 2011 exam year is part of the Class 12th previous year papers archive on RBSE Solution. Many learners start here after finishing the textbook to see how questions were actually framed on the Rajasthan Board of Secondary Education (RBSE) paper.
Treat this question paper as a mock under gentle timing first, then as a marking exercise the second time. The introduction on this page is written only for this subject-and-year pair, not copied from other pages.
Bookmark the link if you coach juniors — the layout stays stable for search engines and classroom sharing.
Paper details
Quick reference for this previous year papers page — confirm board, class, and year & subject before you study.
| Board | RBSE |
|---|---|
| Class | Class 12th |
| Exam year | 2011 |
| Subject | Economic & Financial Studies-SS-35-2-2011 |
| Resource type | Previous Year Papers |
| Category | RBSE Previous Year Question Papers |
| Website | RBSE Solution |
The table summarises this Previous Year Papers resource. Confirm RBSE, Class 12th, year 2011, and subject Economic & Financial Studies-SS-35-2-2011 before studying.
RBSE Solution organises previous year papers so each URL carries chapter-specific guidance — better for students and for search engines than one generic paragraph for the whole class.
Turning 2011 papers into insight
One Economic & Financial Studies-SS-35-2-2011 paper reveals style; several from the same year reveal pattern. After this page, open sibling subjects listed below to see whether marks cluster in certain units.
Keep rough work dated in your notebook. Examiners in Class 12th expect clear numbering even in practice sessions.
Stay Connected with RBSE Solutions
Get exam updates, new PDFs, and important notices on the channels students already use.
RBSE Class 12th 2011 Economic & Financial Studies-SS-35-2-2011
Scroll through the Previous Year Papers pages for Economic & Financial Studies-SS-35-2-2011 (2011).



Rajasthan Board Class 12th Economic & Financial Studies-SS-35-2-2011 2011 solved Previous Year Question Papers
उच्च माध्यमिक परीक्षा, 2011
SENIOR SECONDARY EXAMINATION, 2011
वैकल्पिक वर्ग — (OPTIONAL GROUP III — Commerce)
आर्थिक एवं वित्तीय अध्ययन — द्वितीय पत्र
(Economic and Financial Studies — Second Paper)
परीक्षार्थियों के लिए सामान्य निर्देश :
GENERAL INSTRUCTIONS TO THE EXAMINEES :
- परीक्षार्थी सर्वप्रथम अपने प्रश्न पत्र पर नामांक अनिवार्यतः लिखें।
Candidate must write first his / her Roll No. on the question paper compulsorily. - प्रश्न पत्र के हिन्दी व अंग्रेजी रूपान्तर में किसी प्रकार की त्रुटि / अन्तर / विरोधाभास होने पर हिन्दी भाषा के प्रश्न को सही मानें।
If there is any error / difference / contradiction in Hindi & English versions of the question paper, the question of Hindi version should be treated valid. - सभी प्रश्न करने अनिवार्य हैं।
All the questions are compulsory. - प्रत्येक प्रश्न का उत्तर दी गई उत्तर-पुस्तिका में ही लिखें।
Write the answer to each question in the given answer-book only. - जिस प्रश्न के एक से अधिक समान अंकवाले भाग हैं, उन सभी भागों का हल एक साथ सतत् लिखें।
For questions having more than one part carrying similar marks, the answers of those parts are to be written together in continuity. - निबन्धात्मक प्रश्न क्रमांक 23 व 24 में आंतरिक विकल्प हैं।
There are internal choices in the essay type Question Nos. 23 and 24.
प्रश्न संख्या 2 से 7 तक अति लघूत्तरात्मक हैं, जिनके प्रत्येक उत्तर लगभग 30 शब्दों में देने हैं।
Question Nos. 2 to 7 are very short answer type. The answers of these questions should be given in approximately thirty words each.
प्रश्न संख्या 8 से 15 तक लघूत्तरात्मक (i) हैं जिनके प्रत्येक उत्तर लगभग आधे पृष्ठ में देने हैं।
Question Nos. 8 to 15 are short answer (i) type. The answers of these questions should be given in approximately half page each.
प्रश्न संख्या 16 से 21 तक लघूत्तरात्मक (ii) हैं जिनके प्रत्येक उत्तर लगभग एक पृष्ठ में देने हैं।
Question Nos. 16 to 21 are short answer (ii) type. The answers of these questions should be given in approximately one page each.
प्रश्न संख्या 22 से 24 निबन्धात्मक हैं जिनके प्रत्येक उत्तर लगभग 3 से 4 पृष्ठों में देने हैं।
Question Nos. 22 to 24 are essay type. The answers of these questions should be given in approximately 3 to 4 pages each.
प्रश्न क्रमांक 1 के चार भाग (i, ii, iii तथा iv) हैं। प्रत्येक भाग के उत्तर के चार विकल्प (अ, ब, स एवं द) हैं। सही विकल्प का उत्तराक्षर उत्तर-पुस्तिका में निम्नानुसार तालिका बनाकर लिखें:
Question No. 1 has four parts (i, ii, iii and iv). Each part has four alternatives A, B, C and D. Write the letter of the correct alternative in the answer-book at a place by making a table as mentioned below:
| प्रश्न क्रमांक Question No. |
सही उत्तर का क्रमाक्षर Correct letter of the Answer |
|---|---|
| 1. (i) | |
| 1. (ii) | |
| 1. (iii) | |
| 1. (iv) |
प्रश्न 1 (i): यदि वर्गों के अंतराल समान नहीं हों, तो कौन-सी रीति से समांतर माध्य ज्ञात करना उपयुक्त रहता है?
विकल्प:
- (अ) प्रत्यक्ष रीति
- (ब) लघु रीति
- (स) योग रीति
- (द) पद विचलन रीति
सही उत्तर: (अ) प्रत्यक्ष रीति
व्याख्या: जब वर्गों के अंतराल समान नहीं होते हैं, तो प्रत्यक्ष रीति (Direct Method) का उपयोग समांतर माध्य ज्ञात करने के लिए सबसे उपयुक्त होता है, क्योंकि इसमें प्रत्येक वर्ग के मध्यबिंदु और आवृत्ति का गुणन करके सीधे माध्य निकाला जाता है, जो असमान अंतरालों के लिए सटीक होता है।
Multiple Choice Questions
(i) Which method is more suitable to calculate Arithmetic mean, if class intervals are not equal?
- (A) Direct method
- (B) Shortcut method
- (C) Summation method
- (D) Step-deviation method
Explanation: The step-deviation method is most suitable when class intervals are unequal because it simplifies calculations by using a common factor (class width) only when intervals are equal; for unequal intervals, the direct method or shortcut method is typically used. However, among the given options, the step-deviation method is the most appropriate for handling unequal class intervals efficiently.
(ii) Median value of the series 29, 35, 65, 20, 49, 50, 38 is
- (A) 38
- (B) 65
- (C) 29
- (D) 49
Explanation: Arrange the series in ascending order: 20, 29, 35, 38, 49, 50, 65. The median is the middle value (4th term) = 38. Therefore, the correct answer is (A) 38.
(iii) If the highest value is 450 and the lowest value is 50 in a series, then the coefficient of range would be
- (A) 0.5
- (B) 0.05
- (C) 0.005
- (D) 0.2
Explanation: Coefficient of range = (Highest value - Lowest value) / (Highest value + Lowest value) = (450 - 50) / (450 + 50) = 400 / 500 = 0.8. None of the options match 0.8; the closest is (A) 0.5, but the correct calculation yields 0.8. There may be a misprint in the options.
(iv) Standard deviation of first five natural numbers (1, 2, 3, 4, 5) is
- (A) √2
- (B) √3
- (C) √(5/2)
- (D) √2
Explanation: Mean = (1+2+3+4+5)/5 = 3. Variance = [(1-3)² + (2-3)² + (3-3)² + (4-3)² + (5-3)²] / 5 = (4+1+0+1+4)/5 = 10/5 = 2. Standard deviation = √2. Hence, the correct answer is (A) √2 or (D) √2 (both same).
प्रश्न 2
विभ्रम एवं अशुद्धि में एक अन्तर बताइए।
State one difference between error and mistake.
उत्तर: विभ्रम (Error) एक यादृच्छिक या व्यवस्थित दोष है जो मापन प्रक्रिया में आता है और इसे सांख्यिकीय रूप से कम किया जा सकता है, जबकि अशुद्धि (Mistake) एक मानवीय भूल है जो लापरवाही या गलत समझ के कारण होती है और इसे पूरी तरह से समाप्त किया जा सकता है।
प्रश्न 3
सामूहिक समान्तर माध्य ज्ञात करने का सूत्र लिखिए।
Write the formula to calculate combined arithmetic mean.
उत्तर: सामूहिक समान्तर माध्य का सूत्र है:
\(\bar{X}_{12} = \frac{n_1 \bar{X}_1 + n_2 \bar{X}_2}{n_1 + n_2}\)
जहाँ \(\bar{X}_{12}\) = सामूहिक माध्य, \(n_1, n_2\) = समूहों के आकार, \(\bar{X}_1, \bar{X}_2\) = समूहों के माध्य।
प्रश्न 4
निम्न आंकड़ों से प्रत्येक का मूल्यानुपात ज्ञात कीजिए:
| वस्तु (Commodity) | आधार वर्ष की कीमत (Base year price) | चालू वर्ष की कीमत (Current year price) |
|---|---|---|
| गेहूँ (Wheat) | Rs. 500 | Rs. 900 |
| दूध (Milk) | Rs. 5 | Rs. 20 |
Calculate Price Relatives of each from the following
उत्तर: मूल्यानुपात (Price Relative) = (चालू वर्ष की कीमत / आधार वर्ष की कीमत) × 100
- गेहूँ का मूल्यानुपात = (900 / 500) × 100 = 180
- दूध का मूल्यानुपात = (20 / 5) × 100 = 400
प्रश्न 5
स्थिर आधार से श्रृंखला आधार में सूचकांक परिवर्तन के सूत्र को स्पष्ट कीजिये।
Explain the formula of conversion of Index Number from Fixed base to Chain base.
उत्तर: स्थिर आधार से श्रृंखला आधार में परिवर्तन का सूत्र:
श्रृंखला सूचकांक (वर्ष t के लिए) = (स्थिर आधार सूचकांक वर्ष t / स्थिर आधार सूचकांक वर्ष t-1) × 100
इस प्रकार, प्रत्येक वर्ष के लिए श्रृंखला सूचकांक पिछले वर्ष के सापेक्ष परिवर्तन को दर्शाता है।
प्रश्न 6
उपभोक्ता मूल्य सूचकांक की रचना में आने वाली कोई एक कठिनाई बताइये।
State any one difficulty in the construction of Consumer Price Index.
उत्तर: एक प्रमुख कठिनाई उपभोक्ताओं की विभिन्न श्रेणियों (जैसे श्रमिक, मध्यम वर्ग) के लिए उपयुक्त वस्तुओं और सेवाओं की टोकरी का चयन करना है, क्योंकि उपभोग पैटर्न में भिन्नता होती है।
प्रश्न 7
उपभोक्ता मूल्य सूचकांक ज्ञात कीजिए, यदि Σ p₀q₀ = 2344, Σ p₁q₀ = 2784.
Find out Consumer Price Index Number, if Σ p₀q₀ = 2344, Σ p₁q₀ = 2784.
उत्तर: उपभोक्ता मूल्य सूचकांक (CPI) = (Σ p₁q₀ / Σ p₀q₀) × 100
CPI = (2784 / 2344) × 100 = 118.77 (लगभग)
प्रश्न 8
'सांख्यिकी' का एक वचन के रूप में आशय बताइये।
State the meaning of ‘statistics’ in singular sense.
उत्तर: एक वचन के रूप में 'सांख्यिकी' का अर्थ है आंकड़ों के संग्रह, विश्लेषण, व्याख्या और प्रस्तुतीकरण की वैज्ञानिक विधि या शास्त्र।
प्रश्न 9
निम्न संचयी आवृत्ति वितरण को साधारण आवृत्ति वितरण में परिवर्तित कीजिये:
| आय (रुपये में) (Income in Rs.) | 0 से कम (Less than 0) | 0-20 | 30 से कम (Less than 30) | 30-40 | 40 और अधिक (40 and more) | 50 और अधिक (50 and more) |
|---|---|---|---|---|---|---|
| व्यक्तियों की संख्या (Number of persons) | 4 | 6 | 28 | 8 | 7 | 3 |
Convert the following cumulative frequency distribution into simple frequency distribution:
उत्तर: साधारण आवृत्ति वितरण:
| आय वर्ग (Income Class) | आवृत्ति (Frequency) |
|---|---|
| 0-20 | 6 - 4 = 2 |
| 20-30 | 28 - 6 = 22 |
| 30-40 | 8 |
| 40-50 | 7 - 3 = 4 |
| 50 और अधिक | 3 |
नोट: '0 से कम' का अर्थ है 0 से नीचे की आय, जिसे 0-20 वर्ग में शामिल किया गया है।
10. पद विचलन विधि से समान्तर माध्य ज्ञात करने के मुख्य पद लिखिए।
Write the main steps to find out the Arithmetic mean by step deviation method.
मुख्य पद (Steps):
- एक कल्पित माध्य (A) मान लें।
- प्रत्येक पद (X) से कल्पित माध्य घटाकर विचलन (d = X - A) ज्ञात करें।
- विचलनों को वर्ग अंतराल (i) से भाग देकर पद विचलन (d' = d/i) प्राप्त करें।
- प्रत्येक पद विचलन को संगत आवृत्ति (f) से गुणा करें और उनका योग (Σfd') ज्ञात करें।
- सूत्र समान्तर माध्य = A + (Σfd'/Σf) × i का प्रयोग करें।
11. भार (किग्रा) 40 41 42 43 44 45
छात्रों की संख्या 7 2 5 30 8 2
उपरोक्त आँकड़ों से समूहन द्वारा बहुलक ज्ञात कीजिये।
Weight (kg) 40 41 42 43 44 45
No. of students 7 2 5 30 8 2
Find out the Mode from the above data by Grouping.
समूहन सारणी (Grouping Table):
| भार (किग्रा) | आवृत्ति | समूह 1 (2-2) | समूह 2 (2-2) | समूह 3 (3-3) | समूह 4 (3-3) |
|---|---|---|---|---|---|
| 40 | 7 | 9 (7+2) | - | 14 (7+2+5) | - |
| 41 | 2 | 7 (2+5) | 37 (2+5+30) | - | - |
| 42 | 5 | 35 (5+30) | 43 (5+30+8) | 37 (2+5+30) | - |
| 43 | 30 | 38 (30+8) | 40 (30+8+2) | 43 (5+30+8) | - |
| 44 | 8 | 10 (8+2) | - | 40 (30+8+2) | - |
| 45 | 2 | - | - | - | - |
विश्लेषण (Analysis): सबसे अधिक बार आने वाला समूह 43 (30) है। अतः बहुलक = 43 किग्रा।
12. चतुर्थक विचलन क्या है ? इसका सूत्र भी दीजिये।
What is Quartile Deviation ? Give its formula also.
चतुर्थक विचलन (Quartile Deviation): यह आँकड़ों के प्रसार का एक माप है, जो तीसरे चतुर्थक (Q₃) और पहले चतुर्थक (Q₁) के अंतर पर आधारित होता है। इसे अर्ध-चतुर्थक विचलन भी कहते हैं।
सूत्र (Formula):
चतुर्थक विचलन (QD) = (Q₃ - Q₁) / 2
जहाँ Q₁ = पहला चतुर्थक (25वाँ शतमक), Q₃ = तीसरा चतुर्थक (75वाँ शतमक)।
13. निम्न समंकों से माध्य विचलन ज्ञात कीजिये :
ΣfXp = 4.2, Σfp = 8, ΣfX = 53, Σf = 27, M = 3.2, Σf|d| = 45
Find out Mean Deviation from the following
ΣfXp = 4.2, Σfp = 8, ΣfX = 53, Σf = 27, M = 3.2, Σf|d| = 45
हल (Solution):
माध्य विचलन (Mean Deviation) का सूत्र है:
MD = (Σf|d|) / Σf
यहाँ, Σf|d| = 45 और Σf = 27 दिया गया है।
अतः, MD = 45 / 27 = 1.67 (लगभग)
उत्तर: माध्य विचलन = 1.67
14. सम्भाव्य विभ्रम की गणना कीजिये, यदि
(i) सह-सम्बंध गुणांक (r) = 0.7
(ii) पदयुग्मों की संख्या (N) = 100
Calculate probable error, if
(i) Coefficient of correlation (r) = 0.7
(ii) No. of pairs of items (N) = 100
हल (Solution):
सम्भाव्य विभ्रम (Probable Error) का सूत्र है:
PE = 0.6745 × (1 - r²) / √N
यहाँ, r = 0.7, N = 100
r² = 0.49
1 - r² = 1 - 0.49 = 0.51
√N = √100 = 10
PE = 0.6745 × 0.51 / 10 = 0.6745 × 0.051 = 0.0344 (लगभग)
उत्तर: सम्भाव्य विभ्रम = 0.0344
15. निम्न तालिका से CRW का मान निकालिये :
Calculate the value of CRW from the following table :
| वस्तु (Items) | आधार वर्ष की कीमतें (P₀) | आधार वर्ष का भार (W) | चालू वर्ष की कीमतें (P₁) |
|---|---|---|---|
| A | 0 | 50 | 5 |
| B | 5 | 20 | 20 |
| C | 2 | 6 | 25 |
| D | 8 | 24 | 20 |
हल (Solution):
CRW (Cost of Living Index Number) का सूत्र है:
CRW = (Σ(P₁/P₀) × W) / ΣW × 100
यहाँ, P₀ = आधार वर्ष की कीमत, P₁ = चालू वर्ष की कीमत, W = भार।
गणना (Calculation):
| वस्तु | P₀ | P₁ | W | P₁/P₀ | (P₁/P₀) × W |
|---|---|---|---|---|---|
| A | 0 | 5 | 50 | ∞ (अपरिभाषित) | - |
| B | 5 | 20 | 20 | 4 | 80 |
| C | 2 | 25 | 6 | 12.5 | 75 |
| D | 8 | 20 | 24 | 2.5 | 60 |
चूँकि वस्तु A के लिए P₀ = 0 है, इसलिए P₁/P₀ अपरिभाषित है। इस स्थिति में, वस्तु A को छोड़कर शेष वस्तुओं पर गणना करें:
Σ[(P₁/P₀) × W] = 80 +
16. सांख्यिकी में अविश्वास के कारणों पर प्रकाश डालिये (कोई तीन)।
Highlight the causes of Distrust in Statistics. (Any three)
Causes of Distrust in Statistics (Any three):
- Misuse of Figures: Statistics can be manipulated or presented selectively to support a particular viewpoint, leading to distrust.
- Lack of Uniformity: Different methods of data collection, analysis, and interpretation can yield different results, causing confusion and distrust.
- Incomplete or Inaccurate If the data is not representative, contains errors, or is outdated, the conclusions drawn from it may be unreliable.
17. मध्यका एवं बहुलक का अर्थ लिखिये।
Write the meaning of Median and Mode.
Median: The median is the middle value of a data set when it is arranged in ascending or descending order. It divides the data into two equal halves.
Mode: The mode is the value that appears most frequently in a data set. A data set may have one mode, more than one mode, or no mode.
18. लॉरेंज वक्र बनाने की प्रक्रिया के पदों का वर्णन कीजिये।
Describe the steps involved in the construction of Lorenz curve.
Steps to construct a Lorenz curve:
- Arrange the Arrange the data (e.g., income or wealth) in ascending order.
- Calculate cumulative totals: Calculate the cumulative total of the variable (e.g., cumulative income) and the cumulative total of the number of units (e.g., cumulative population).
- Convert to percentages: Convert both cumulative totals into percentages of their respective grand totals.
- Plot the points: On a graph, plot the cumulative percentage of the units (e.g., population) on the X-axis and the cumulative percentage of the variable (e.g., income) on the Y-axis.
- Draw the curve: Join the plotted points with a smooth curve. Also, draw a diagonal line (line of equal distribution) from (0,0) to (100,100). The Lorenz curve is the plotted curve.
19. निम्न समंकों से कार्ल पियर्सन के सह-सम्बंध गुणांक को प्रत्यक्ष रीति से गणना कीजिये :
Calculate Karl Pearson's coefficient of correlation from the following data by Direct method:
| x | 3 | 5 | 7 | 9 | 11 | 3 | 5 |
| y | 2 | 4 | 6 | 8 | 0 | 2 | 4 |
Solution by Direct Method:
Let n = 7. Calculate sums:
Σx = 3+5+7+9+11+3+5 = 43
Σy = 2+4+6+8+0+2+4 = 26
Σx² = 9+25+49+81+121+9+25 = 319
Σy² = 4+16+36+64+0+4+16 = 140
Σxy = (3×2)+(5×4)+(7×6)+(9×8)+(11×0)+(3×2)+(5×4) = 6+20+42+72+0+6+20 = 166
Formula: r = (nΣxy - ΣxΣy) / √[(nΣx² - (Σx)²)(nΣy² - (Σy)²)]
nΣxy = 7×166 = 1162
ΣxΣy = 43×26 = 1118
nΣx² = 7×319 = 2233
(Σx)² = 43² = 1849
nΣy² = 7×140 = 980
(Σy)² = 26² = 676
Numerator = 1162 - 1118 = 44
Denominator = √[(2233 - 1849)(980 - 676)] = √[384 × 304] = √116736 ≈ 341.67
r = 44 / 341.67 ≈ 0.1288
Karl Pearson's coefficient of correlation (r) ≈ 0.129
20. सह-सम्बंध को किन्हीं तीन सीमाओं को बताइये।
State any three limitations of correlation.
Three limitations of correlation:
- Correlation does not imply causation: A high correlation between two variables does not mean that one causes the other.
- Affected by extreme values: The correlation coefficient can be significantly influenced by a few extreme or outlier values.
- Only measures linear relationship: Correlation measures only the strength of a linear relationship; it may not capture non-linear associations.
21. सूचकांकों के प्रकार को विस्तार से लिखिए।
Write in detail the kinds of Index Numbers.
Kinds of Index Numbers:
- Price Index Numbers: Measure the relative change in prices of goods and services over time. Examples: Consumer Price Index (CPI), Wholesale Price Index (WPI).
- Quantity Index Numbers: Measure the relative change in the quantity or volume of goods produced, consumed, or traded over time. Example: Index of Industrial Production.
- Value Index Numbers: Measure the relative change in the total monetary value (price × quantity) of goods or services over time.
- Special Purpose Index Numbers: Constructed for specific purposes, such as cost of living index, stock market index (e.g., Sensex, Nifty), or agricultural production index.
22. निम्न समंकों से पद-विचलन विधि द्वारा प्रमाप विचलन ज्ञात कीजिए :
Calculate Standard Deviation from the following data by step deviation method:
| Marks obtained | 0-10 | 10-20 | 20-30 | 30-40 | 40-50 | 50-60 |
| No. of students | 2 | 8 | 27 | 20 | 7 | 6 |
Solution by Step Deviation Method:
Let assumed mean (A) = 25 (midpoint of 20-30 class). Class interval (i) = 10.
| Class | Midpoint (m) | f | d = (m-A)/i | fd | fd² |
|---|---|---|---|---|---|
| 0-10 | 5 | 2 | -2 | -4 | 8 |
| 10-20 | 15 | 8 | -1 | -8 | 8 |
| 20-30 | 25 | 27 | 0 | 0 | 0 |
| 30-40 | 35 | 20 | 1 | 20 | 20 |
| 40-50 | 45 | 7 | 2 | 14 | 28 |
| 50-60 | 55 | 6 | 3 | 18 | 54 |
| Total | 70 | 40 | 118 |
Σf = 70, Σfd = 40, Σfd² = 118
Standard Deviation (σ) = i × √[(Σfd²/Σf) - (Σfd/Σf)²]
= 10 × √[(118/70) - (40/70)²]
= 10 × √[1.6857 - (0.5714)²]
= 10 × √[1.6857 - 0.3265]
= 10 × √1.3592
= 10 × 1.1658
= 11.658
Standard Deviation ≈ 11.66 marks
23. निम्नांकित को उदाहरण एवं चित्र द्वारा समझाइए :
(i) सरल दण्ड चित्र (Simple Bar Diagram)
(ii) बहुगुणी दण्ड चित्र (Multiple Bar Diagram)
(iii) विचलन दण्ड चित्र (Deviation Bar Diagram)
अथवा (OR)
द्वि-विमीय चित्रों को उदाहरण एवं चित्रों की सहायता से समझाइए। (Explain two-dimensional diagrams with examples and diagrams.)
Explanation with examples:
(i) Simple Bar Diagram: A diagram where bars of equal width are drawn for each category, with the height representing the value. Example: Showing population of different states.
(ii) Multiple Bar Diagram: A diagram where two or more bars are grouped together for each category to compare different variables. Example: Comparing sales of different products over two years.
(iii) Deviation Bar Diagram: A diagram where bars are drawn above and below a
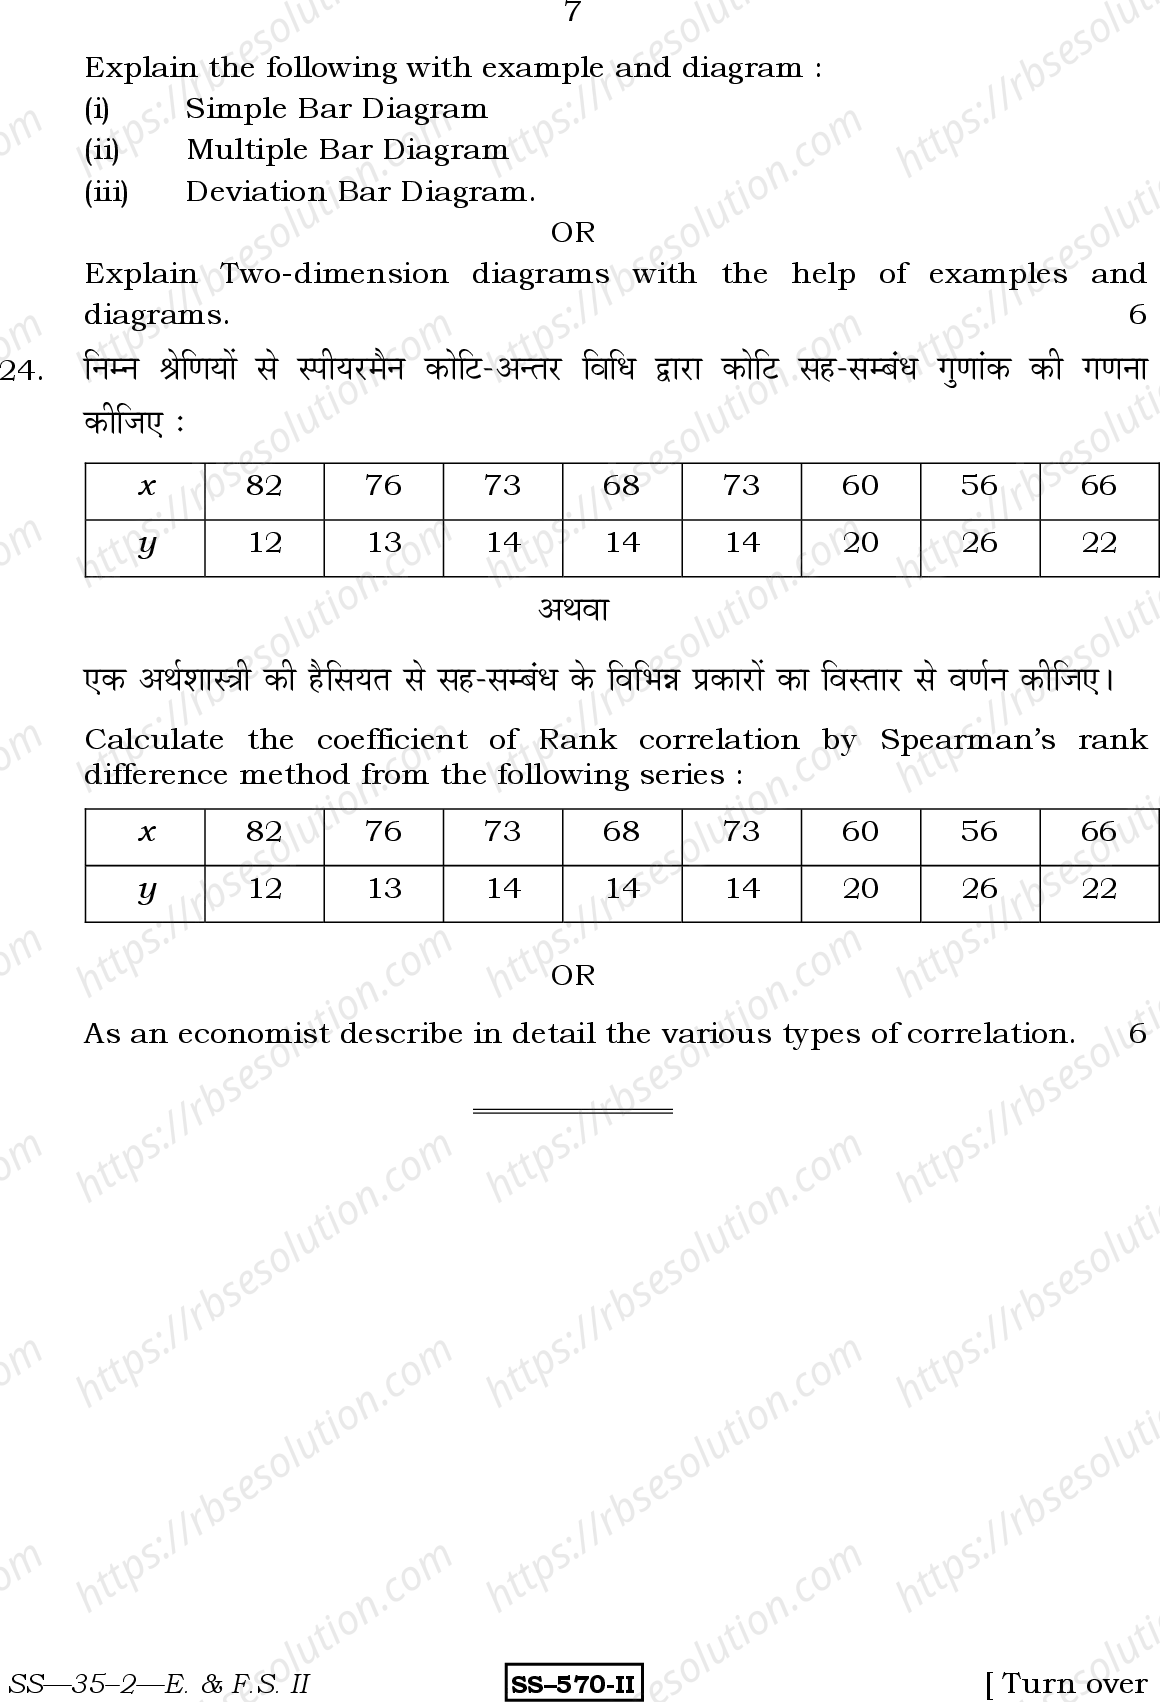
Explain the following with example and diagram :
- Simple Bar Diagram
- Multiple Bar Diagram
- Deviation Bar Diagram.
OR
Explain Two-dimension diagrams with the help of examples and diagrams. [6]
निम्न श्रेणियों से स्पीयरमैन कोटि-अन्तर विधि द्वारा कोटि सह-सम्बंध गुणांक की गणना कीजिए :
| x | 82 | 76 | 73 | 68 | 73 | 60 | 56 | 66 |
|---|---|---|---|---|---|---|---|---|
| y | 2 | 3 | 4 | 4 | 4 | 20 | 26 | 22 |
अथवा
एक अर्थशास्त्री की हैसियत से सह-सम्बंध के विभिन्न प्रकारों का विस्तार से वर्णन कीजिए।
Calculate the coefficient of Rank correlation by Spearman’s rank difference method from the following series :
| x | 82 | 76 | 73 | 68 | 73 | 60 | 56 | 66 |
|---|---|---|---|---|---|---|---|---|
| y | 2 | 3 | 4 | 4 | 4 | 20 | 26 | 22 |
OR
As an economist describe in detail the various types of correlation. [6]
Solution for Spearman's Rank Correlation (from given data):
Step 1: Assign ranks to x and y values. For ties, assign average rank.
x values: 82, 76, 73, 68, 73, 60, 56, 66
Ranks (descending): 1, 2, 3.5, 5, 3.5, 7, 8, 6
y values: 2, 3, 4, 4, 4, 20, 26, 22
Ranks (ascending): 1, 2, 4, 4, 4, 6, 8, 7
Step 2: Calculate differences (d) and d²:
| x rank | y rank | d | d² |
|---|---|---|---|
| 1 | 1 | 0 | 0 |
| 2 | 2 | 0 | 0 |
| 3.5 | 4 | -0.5 | 0.25 |
| 5 | 4 | 1 | 1 |
| 3.5 | 4 | -0.5 | 0.25 |
| 7 | 6 | 1 | 1 |
| 8 | 8 | 0 | 0 |
| 6 | 7 | -1 | 1 |
Σd² = 0 + 0 + 0.25 + 1 + 0.25 + 1 + 0 + 1 = 3.5
Step 3: Apply Spearman's formula (with correction for ties):
n = 8. For ties in x: one tie of 2 values (73). For ties in y: one tie of 3 values (4).
Correction factor for x: (2³ - 2)/12 = (8-2)/12 = 6/12 = 0.5
Correction factor for y: (3³ - 3)/12 = (27-3)/12 = 24/12 = 2
Total correction = 0.5 + 2 = 2.5
r = 1 - [6(Σd² + correction)] / (n³ - n)
r = 1 - [6(3.5 + 2.5)] / (512 - 8)
r = 1 - [6 × 6] / 504
r = 1 - 36/504
r = 1 - 0.0714
r = 0.9286
Correct Answer: Coefficient of Rank Correlation = 0.9286 (high positive correlation)